 Monitto

Monitto
Your Mac, at a glance.
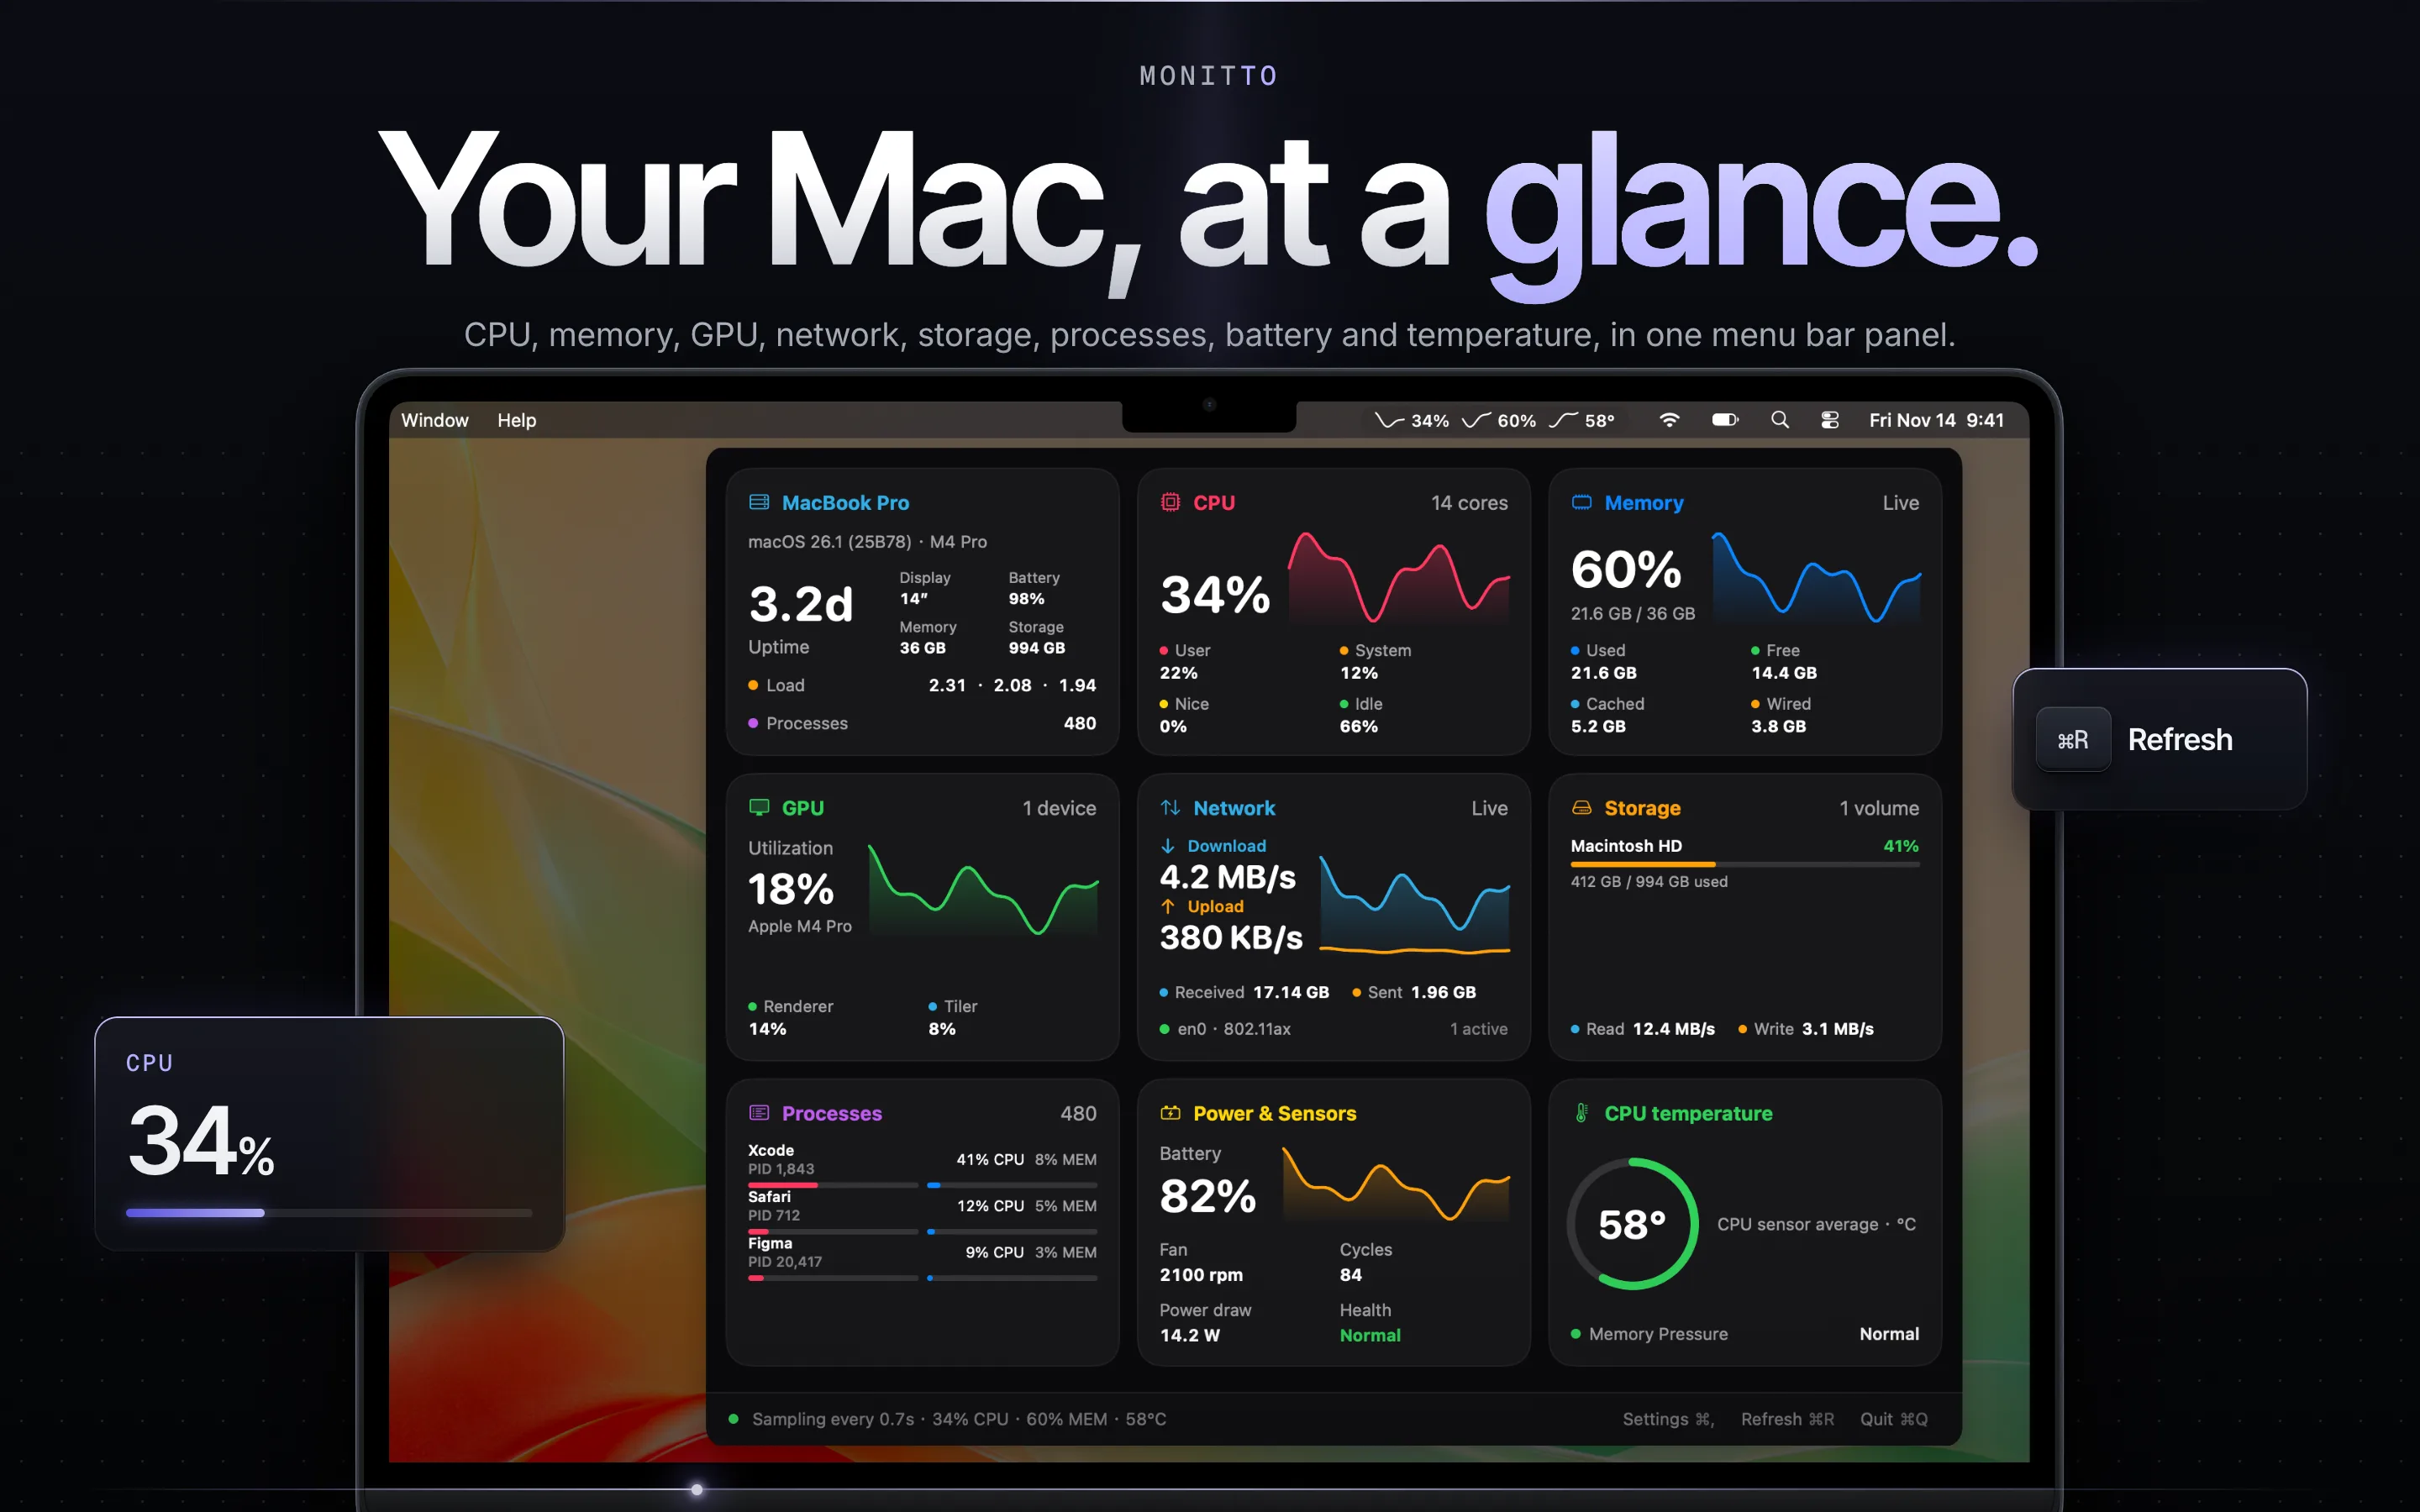
CPU, memory, GPU, network, storage, processes, battery and temperature,in one menu bar panel.Keep the few numbers you care about in the menu bar,and get a notification when one of them runs too high.
macOS 15 or later · Apple silicon and Intel
Is Monitto for you?
When your Mac gets slow, hot or loud, the answer is spread across several places: Activity Monitor for CPU and memory, System Settings for the battery, and temperature and fan speed aren’t shown anywhere.
Monitto puts all of it in one panel under its menu bar icon.
It’s for you if you want to know what your Mac is doing without opening several apps. If Activity Monitor already tells you enough, you don’t need it.
What it does
- Panel
- Host, CPU, memory, GPU, network, storage and processes, plus battery, temperature, fan speed and power draw. Each is a card with a live chart; hover a chart for exact values.
- Layout
- Drag cards to reorder them, resize them, and hide the ones you don’t need.
- Menu bar
- Pick any of CPU, memory, network, disk, battery and temperature, shown as numbers, small charts or both.
- Alerts
- Set limits for CPU load, memory, disk space and CPU temperature, and get a notification, with an optional sound.
- Lightweight
- Every card reads from one shared sample, taken every 0.3 to 5 seconds. Costly readings slow down or pause while the panel is closed.
- Native
- No Dock icon unless you turn it on, and the panel can be zoomed as a whole. Light and dark appearance, English and Simplified Chinese, launch at login and in-app updates.
Most readings use public macOS interfaces. Temperatures, fan speed and power draw come from sensors Apple doesn’t document, so they can be missing on some Macs.
Privacy
- Local
- Everything is read on your Mac and stays there. Monitto has no account and no analytics.
- Network
- It goes online only to check Monitto’s GitHub Releases feed for updates; if that fails, monitoring keeps working.
- Files
- Settings are kept in macOS user defaults. The only file Monitto writes is the diagnostics report you export yourself.
Quick start
- InstallDownload the DMG, open it and drag Monitto into Applications.
- Open the panelClick the Monitto icon in the menu bar. Hover a chart or a number to see what it means; press ⌘R to refresh.
- Set it upClick Settings ⌘, at the bottom of the panel to choose the appearance and language, the menu bar items, alert limits and which cards to show.
Made by

Seaony
Next year brings its own snow.
Singapore
A full-stack developer who makes products.What I build changes from one project to the next,but I care about the same thing every time:every detail has been looked after, and the people using it can feel it.
Other projects




 mameya.app